Hi,
The 20.8 update includes the following new functionality and fixes:
-
Following the single selection speed increase in a non-scrolling window in the previous update, in this version the worksheet display technology has been changed, which results in significantly faster scrolling and screen repainting.
For worksheets with a large number of cells filled with colors, with many cell frames, cell markers, cross-highlighting and for a maximized window, this can mean e.g. 4 times faster screen redrawing.
Further new graphic effects should be added later this year. -
The “imageIf()” function and the user-created functions in DLL libraries returning images can now also accept the built-in image names as parameters: cross, tick, flag-red, flag-green, flag-white, star, star-half, star-empty, heart, heart-half, heart-empty.
(In addition to file paths and names of the images inserted by users.) -
Calculating the min/max/count/sum/mean/etc. values displayed automatically on the top worksheet window toolbar for each selection
( Selecting functions to display within the table toolbar and related options )
has been optimized for most of the functions and it’s now performed instantly regardless of the worksheet size. Previously, for cell selections made within large (e.g. with millions of rows) worksheets, it could take a few seconds (even though it’s performed in the background, not interfering with any editing actions). Adding some more advanced of the remaining 18 worksheet status toolbar functions (like mode(), quartile()) can however result in a similar updating time. -
To perform multiple, combined selections, in addition to the using the mouse cursor
you can now also use the keyboard keys. The 2nd pane of the table status toolbar displays the cell type breakdown for the entire combined selection (not only the last one). Performing multiple selections to combine their values -
The image/bitmap representation of cell ranges copied by default on to the Clipboard with the standard “Edit > Copy” command was using the default column widths and row heights to draw the image of the copied range. The original actual values are used now.
-
The numeric, cardinal codes displayed by formulas returning images are now hidden. It’s helpful if a given image doesn’t fill the entire cell and could leave that code visible in the background.
-
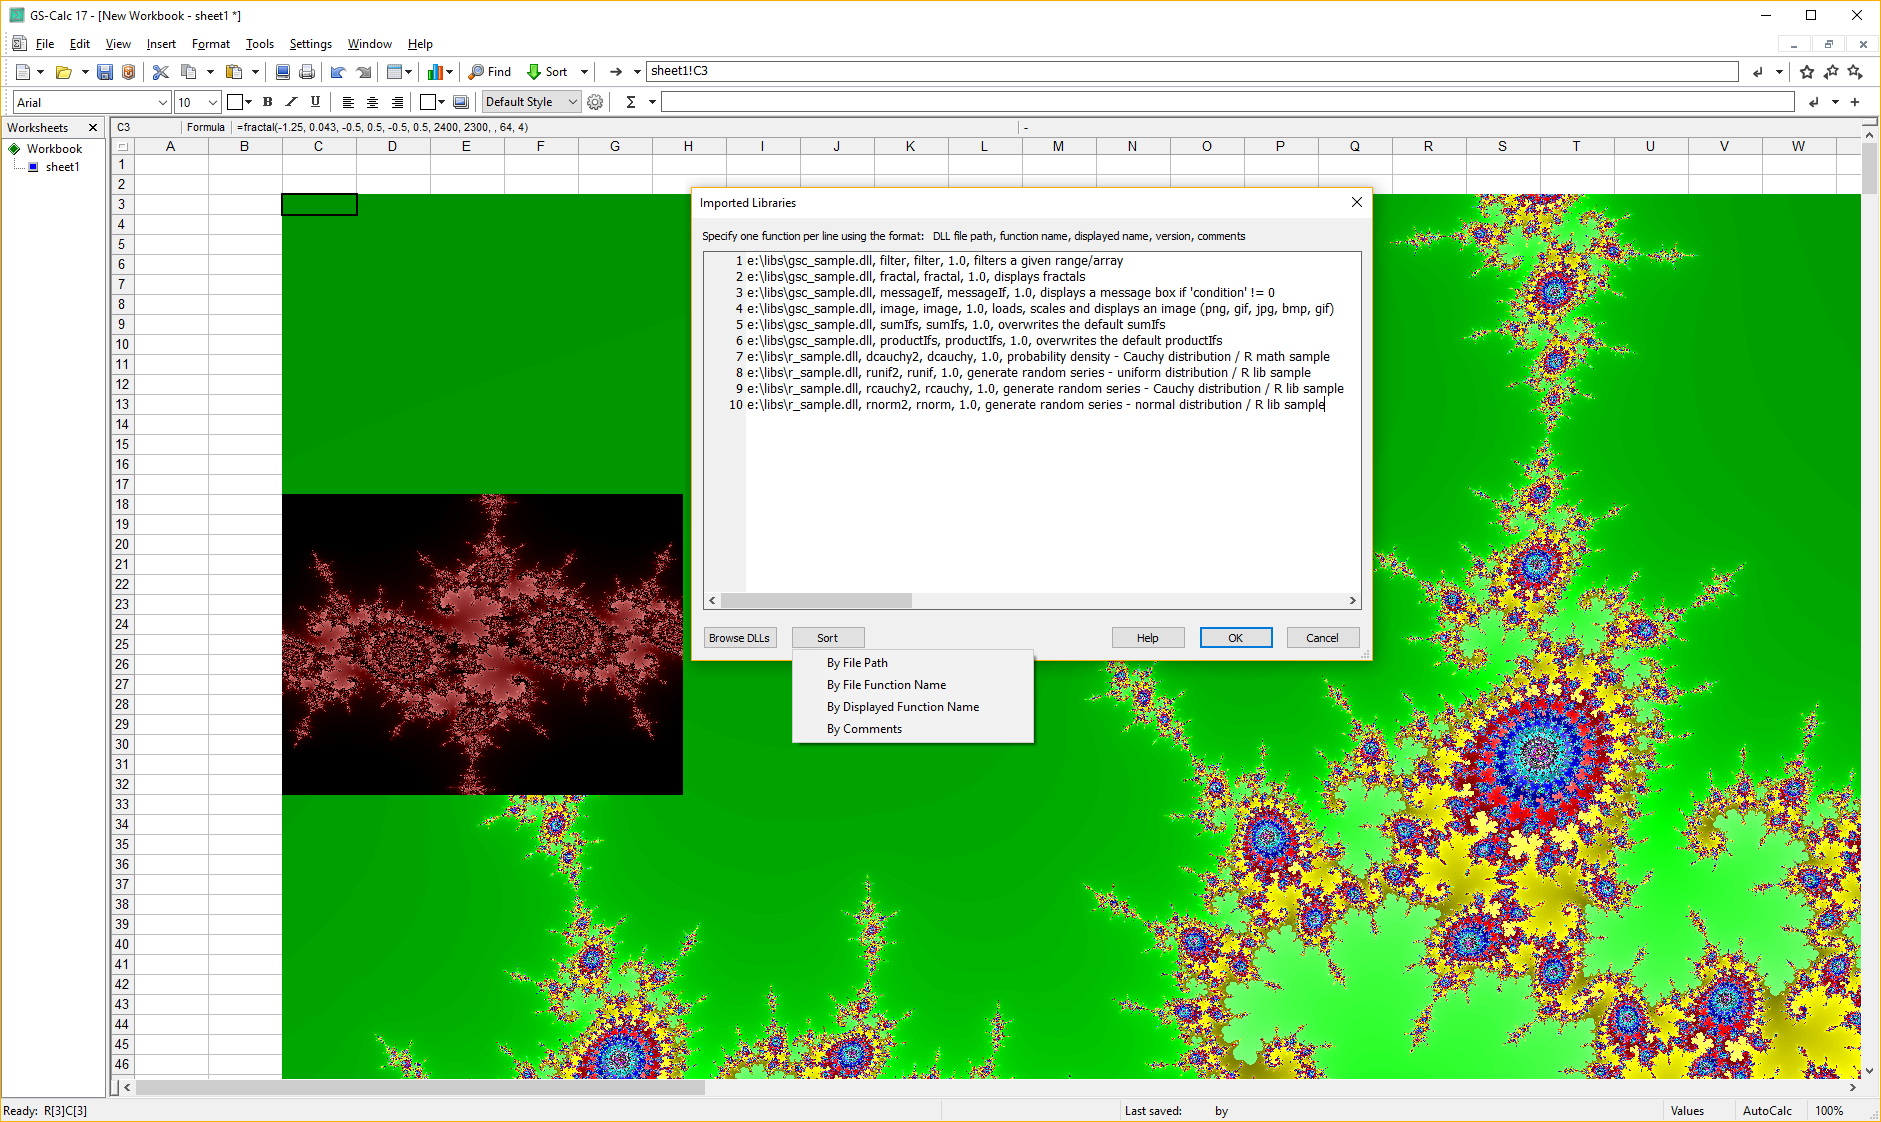
A bug fix: adding the “imageIf()” function (that has been working correctly) in the ver. 20.7 caused another problem with the user-created DLL functions returning images. (E.g. the demo “fractal” function in the “sample.gsc” file no longer worked.) It was functioning correctly in all previous versions.
To generate images like https://citadel5.com/images/gsc17_scr1.png , in the “sample.gsc” file choose the “DLL libraries” worksheet and remove the leading “//” characters from cells with the sample “fractal()” formula strings. -
A number of help topics available in the online help and not available in the included Help file has been added to the latter. This includes the following:
Copying cells vs duplicating copied cells
Entering dataUsing AutoScroll Range to automatically move between cells
Using AutoScroll Range to automatically move between cellsReplacing formulas automatically in worksheets
Replacing formulas automatically in worksheetsPerforming multiple selections to combine their values
Performing multiple selections to combine their valuesInserting sequences and series using formulas
Inserting seriesSelecting functions to display within the table toolbar
and related options
Selecting functions to display within the table toolbar and related optionsHiding view elements / maximizing the table view display areas
Hiding view elements / maximizing the table view display areasCross-highlighting columns/rows for better readability
Cross-highlighting columns/rows for better readabilityUsing the Dark Mode
Using the Dark ModeCharts in Cells
Creating mini-charts in cellsInserting images, files in worksheets
Inserting images, files in worksheetsImages and lists of images in cell
Images in Cells -
Note: The file format remains unchanged in the latest updates. The two latest file format changes occurred in the past when increasing the number of columns to 16K, then when increasing the number of rows to 32M (and even then, the new format is used only if the data exceed the previous 12M row limit).
-
Tip: when installing new versions, you can simply install them in the same location. If you earlier rename the older “gscalc.exe” file(s) in the existing installation folder, you’ll be able to keep multiple older versions in one place and start them later e.g. double-
clicking such files (with the desktop shortcut pointing to the “gscalc.exe” file).
GS-Calc 20.8.1 - update - 26-06-2024
- Fixed the following: In the pivot table bottom pane, moving the rectangle around a given selected cell leaves parts of that rectangle on the screen as it’s not fully repainted and aligned correctly.